Stability extracts
Stability HDM extracts
We have performed stability studies to see if our HDM (house dust mite) extracts such as the D. pteronyssinus extract and D. farinae extracts are still stable. We collected data over the course of 5 years and the conclusion is that the HDM extracts are still within the limits although there is a change. The limits are based on the European Pharmacopoeia Monography of allergens (01/2010:1063). Because we have multiple large batches which are produced in 2015 it is important for you to know that these batches are still reliable.
New batches of HDM extracts
Although the batches from 2015 are still within the limits we have also produced new batches. If you need HDM extract our advise would be to use our newer batches. Please contact us for a quotation and more information about our house dust mite extracts.
How we have performed the stability study
Researches need to have reliable source material which remains stable for multiple years so they can perform their research during years based on this material. For this reason we always produce large batches so we can assure that you have the same material available and this to avoid switching and testing every new batch. Logically data on long-term storage, e.g. years, is necessary.
Our D. pteronyssinus and D. farinae house dust mite extracts are natural products which means that they are a mixture with different components. To test the stability of these mixtures we test on the major components described in the literature and their activity.
We collected data over the course of 5 years and see that the products are still within the limits although there is a change. The limits are based on the European Pharmacopoeia Monography of allergens (01/2010:1063). We have tested on the following components:
- Water content
- Protein content based on Bradford (mg/g)
- Protein content based on BCA (mg/g)
- Major allergens content such as Der p 1/ Der p 2/ Der f 1 and Derf f 2
Stability D. pteronyssinus extracts
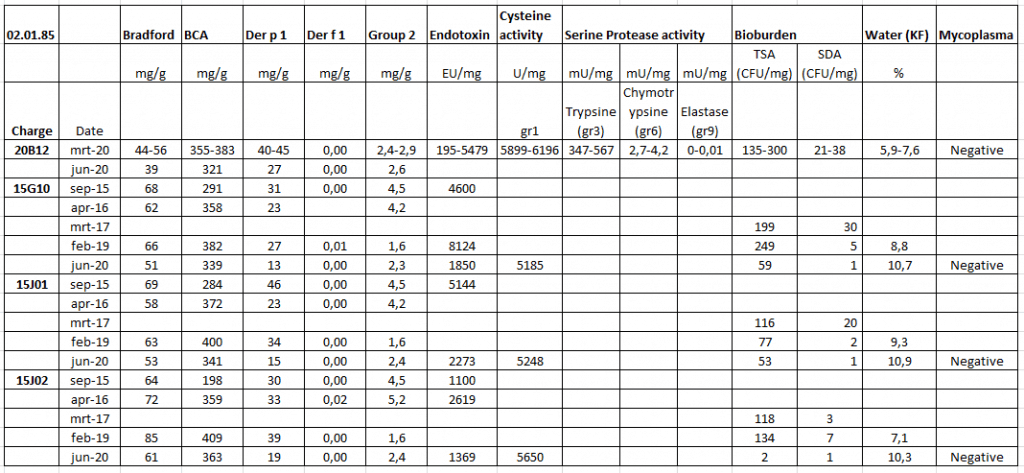
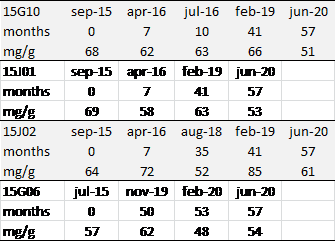
We have performed stability studies to see if our D. pteronyssinus extracts are still stable. In the table below you can find the stability for 4 of our D. pteronyssinus (02.01.85) batches.
The first 2 numbers of the charge number stands for the year of production, for example 20B12 was produced in 2020 and 15G10 was produced in 2015.
Stability study D. farinae extracts
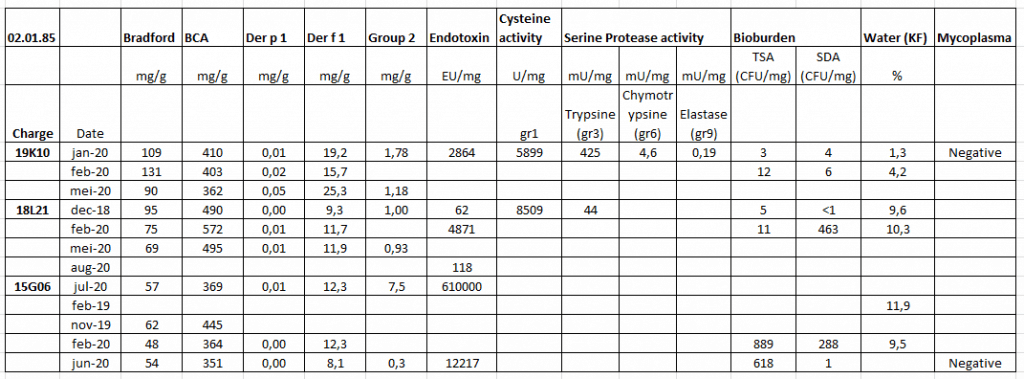
We have performed stability studies to see if our D. farinae extracts are still stable. In the table below you can find the stability for 3 of our D. farinae (02.02.85) batches.
The first 2 numbers of the charge number stands for the year of production, for example 19K10 was produced in 2019 and 15G06 was produced in 2015.
Water content HDM extracts
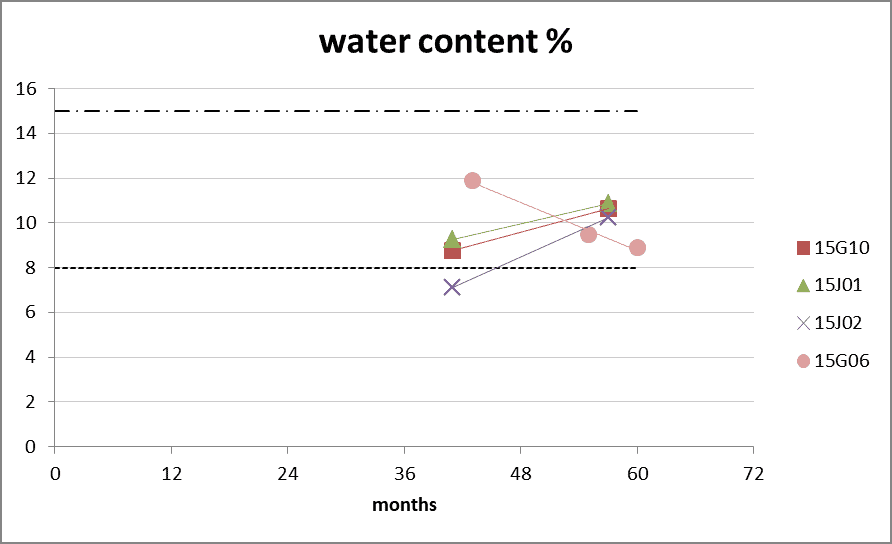
Figure 1: Water content according Karl Fisher titration during long-term storage at 20°C. The dotted line represents the product specifications of 8%. The stripped line represents the rejection limit of 15%. 0 months is batch release time. The water content is not measured during 2015 till 2018 due to technical reasons.
- Batch 15G10, 15J01 and 15J02: D. pteronyssinus extract
- Batch 15G06 D. farinae extract
Bradford protein content
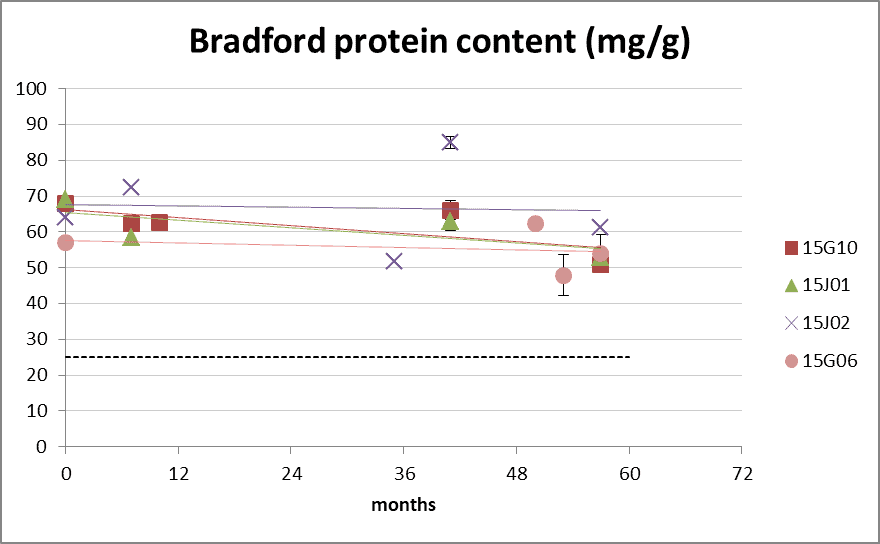
Figure 2: protein content according Bradford method during long-term storage at 20°C. The dotted line represents the lower product specifications of 25 mg/g (upper limit 250 mg/g not depicted). 0 months is batch release time.
- Batch 15G10, 15J01 and 15J02: D. pteronyssinus extract
- Batch 15G06 D. farinae extract
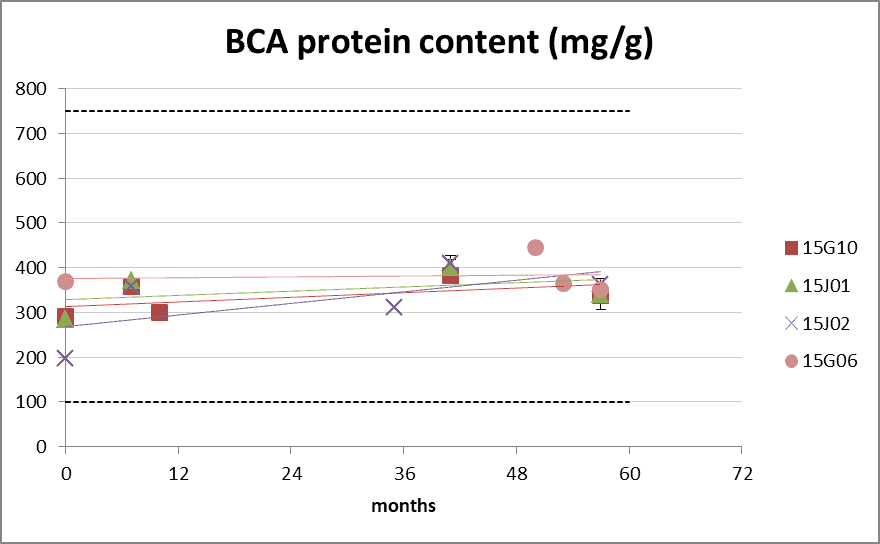
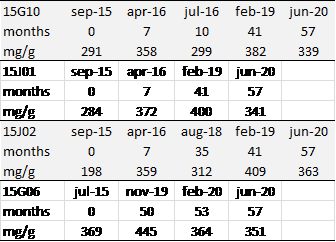
BCA protein content
Figure 3: protein content according BCA method during long-term storage at 20°C. The dotted lines represents the product specification limits of 100-750 mg/g. 0 months is batch release time.
- Batch 15G10, 15J01 and 15J02: D. pteronyssinus extract
- Batch 15G06 D. farinae extract
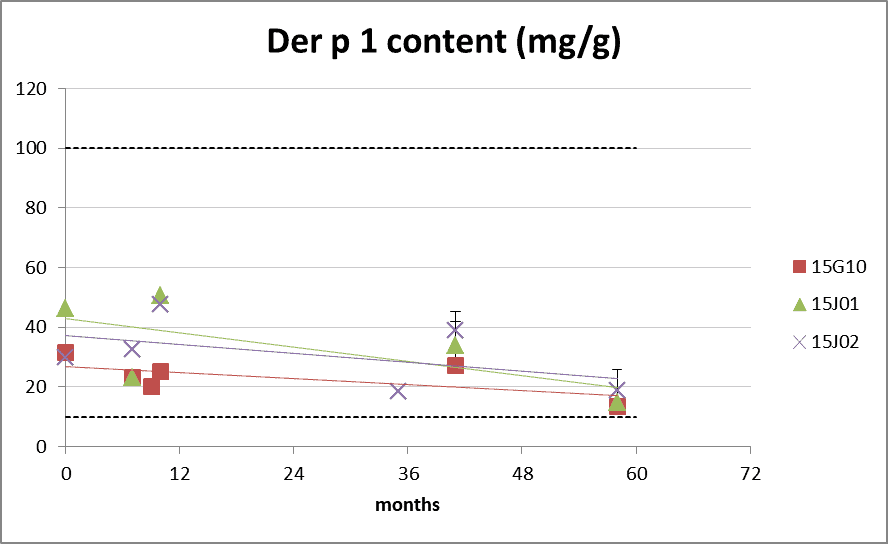
Der p 1 and Der f 1 allergen content
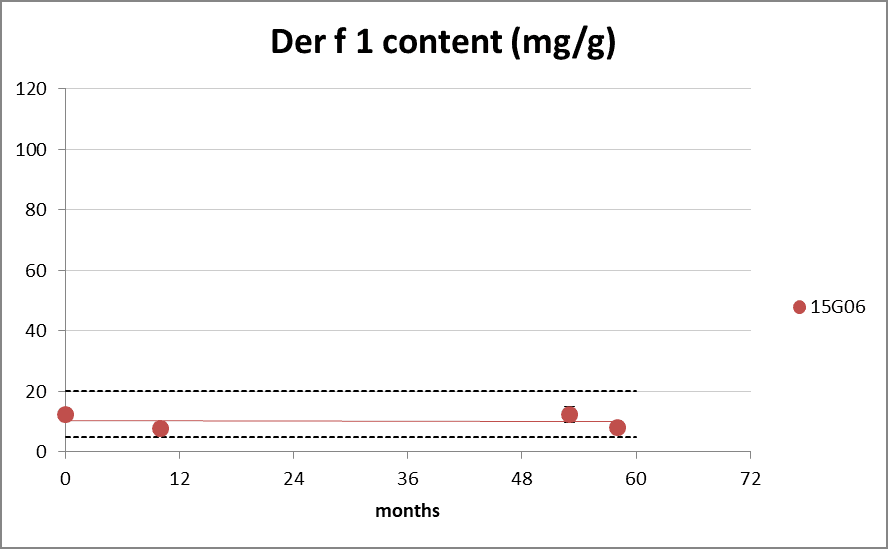
Figure 4: group 1 content during long-term storage at 20°C. The dotted lines represents the Citeq Biologics specifications of 10-100 mg/g (Der p 1) and 5-20mg/g (Der f 1). 0 months is batch release time.
Der p 2 and Der f 2 allergen content
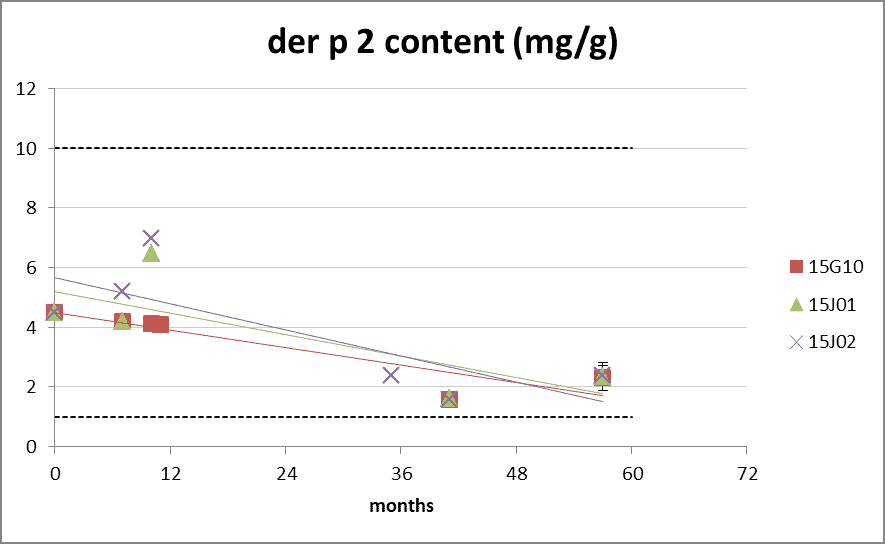
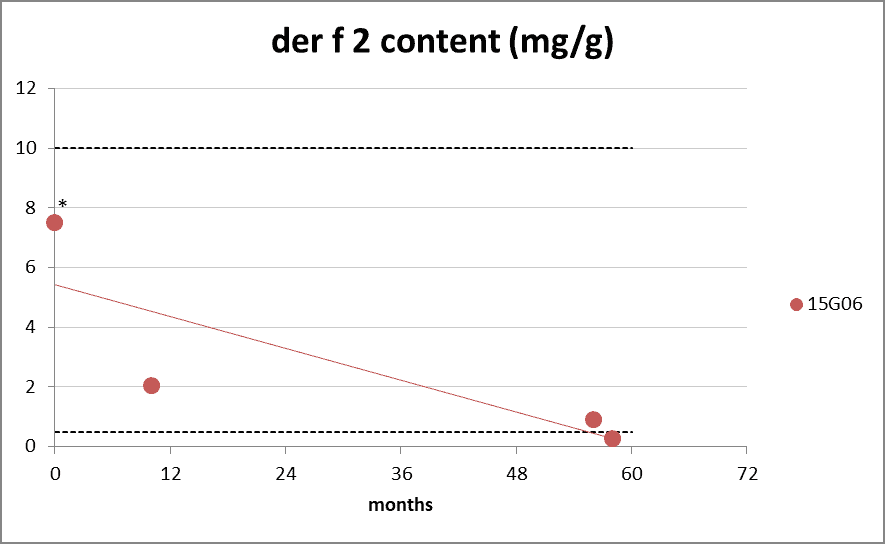
Figure 5: group 2 content during long-term storage at 20°C. The dotted lines represents the Citeq Biologics specifications of 1-10 mg/g (der p 2) and 0.5-10 mg/g (der f 2). 0 months is batch release time. (*value of der f 2 at 0 months gives a distorted view due to technical aspects of the assay in 2015).
SDS-page for D. pteronyssinus extracts
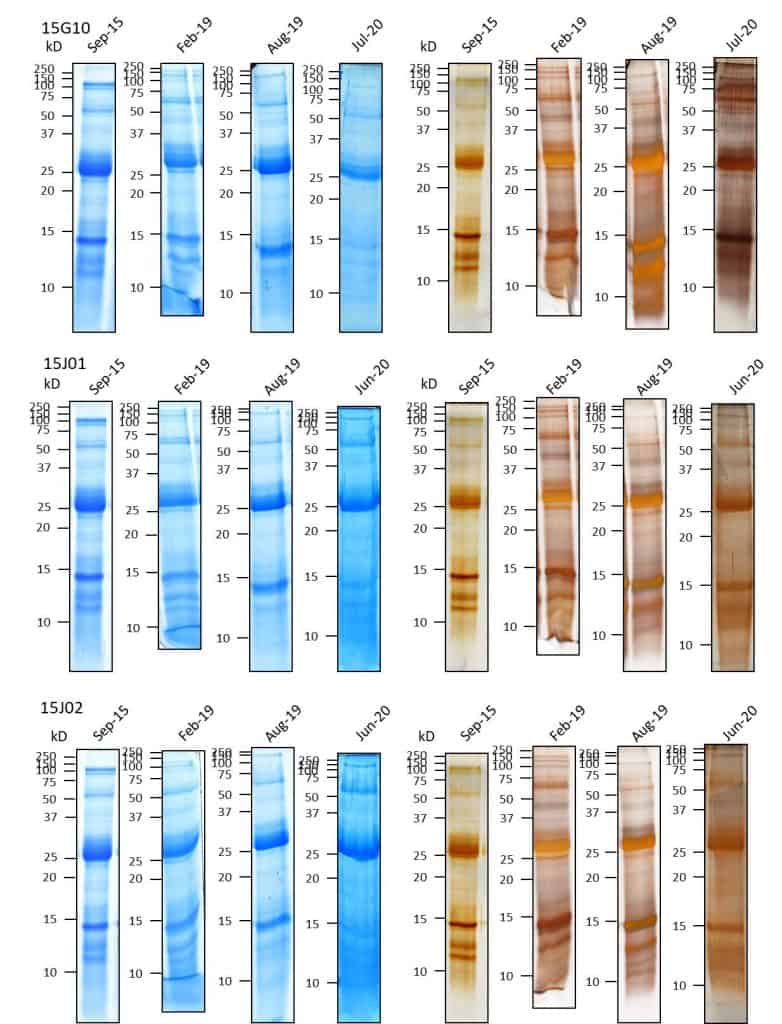
Figure 6: SDS-PAGE protein profile of D. pteronyssinus extract batches 15G10, 15J01 and 15J02 at batch release and during long-term storage at 20°C. Using Bradford total protein method 8 µg (CBB-staining) or 4 µg (Silver-staining) protein was applied to the SDS-PAGE. Around 25 kDa (Der p1) and around 14 kDa (Der p2).
SDS-page for D. farinae extracts
Figure 7: SDS-PAGE protein profile of D. farinae extract 15G06 at batch release and during long-term storage at 20°C. Using Bradford total protein method 8 µg (CBB-staining) or 4 µg (Silver-staining) protein was applied to the SDS-PAGE. Around 25 kDa (Der f1).

